
[인프라] Grafana, Prometheus 시스템 매트릭 모니터링
- 인프라/그라파나 & 프로메테우스
- 2022. 7. 16. 18:15

참고
개요
- Grafana, Prometheus, node-exporter 를 이용해서 시스템 메트릭을 모니터링 할 수 있도록 대시보드 구축 진행합니다.
node-exporter 란 무엇인가?
- node-exporter 란 UNIX 계열 커널을 가진 하드웨어와 OS 릭 등 "시스템 메트릭" 을 수집하는 Exporter 입니다.
- Pormetheus 재단이 공식적으로 지원하고 있는 Exporter 중 하나이며, Prometheus 로 모니터링 시스템을 구축 시스템 메트릭 수집을 위해 가장 우선적으로 고려되는 Exporter 이기도 합니다.
Exporter 란? 특정 메트릭을 수집해서 엔드 포인트에 노출 시키는 소프트웨어 혹은 에이전트라고 보시면 됩니다. node-exporter 가 UNIX 계열 서버의 cpu, memory 등의 메트릭을 수집할 수 있는 것처럼, DB, 하드웨어, 메시지 시스템, 저장소 등 여러 시스템에 대한 익스포터가 존재하며, CollectD 등 기존의 서버 모니터링에 사용되는 에이전트들과 통합할 수 있는 Exporter 도 존재합니다.
node-exporter 설치
- Docker 를 통하여 node-exporter 설치를 진행할 수 있습니다.
- 저는 docker-compose.yml 파일을 작성하여 Docker-Compose 로 실행하였습니다.
  node_exporter:
    container_name: node_exporter
    image: prom/node-exporter
    ports:
- 9100:9100- 위와 같이 node-exporter 컨테이너를 실행할 수 있는 Docker-Compose 를 정의하였습니다.
> docker-compose up node_exporter- 위 명령어를 통해 node-exporter 컨테이너를 실행합니다.
- 정상적으로 컨테이너가 실행 되었다면,
localhost:9100/metrics을 통해 현재 수집되는 데이터가 있는지 확인합니다.
# HELP go_gc_duration_seconds A summary of the pause duration of garbage collection cycles.
# TYPE go_gc_duration_seconds summary
go_gc_duration_seconds{quantile="0"} 0.000184
go_gc_duration_seconds{quantile="0.25"} 0.000184
go_gc_duration_seconds{quantile="0.5"} 0.000184
go_gc_duration_seconds{quantile="0.75"} 0.000184
go_gc_duration_seconds{quantile="1"} 0.000184
go_gc_duration_seconds_sum 0.000184
go_gc_duration_seconds_count 1

...
Prometheus 연동
- 이제 Prometheus 에서 node-exporter 가 수집하고 있는 metric 을 스크래이핑 해봅니다.
- Prometheus 설정 파일을 보면 scrape_config 밑에 다음과 같이 node-exporter 관련 job 이 등록 된 것을 확인할 수 있습니다.
scrape_configs:
  # Scrape Prometheus itself.
  - job_name: 'prometheus'
    # metrics_path defaults to '/metrics'
    # scheme defaults to 'http'.

  - job_name: 'node-exporter'
    scrape_interval: 5s

    static_configs:
- targets: ['192.168.100.167:9100']- static_config 밑에 targets 에서 node-exporter 가 구동된 인스턴스들의 IP:9100 을 적어주면, Prometheus 가 scrape_interval 에 설정된 주기마다 각 인스턴스들에서 수집되는 메트릭을 스크래이핑하여 저장합니다.
- 이제 Proemtheus 를 구동시킵니다.
- Prometheus 역시 docker-compose.yml 파일에 작성하여 컨테이너 실행합니다.
  prometheus:
    image: prom/prometheus
    container_name: prometheus
    ports:
      -  9090:9090
    volumes:
      - D:/postgresql/prometheus/data/:/prometheus
      - D:/postgresql/prometheus/:/etc/prometheus/
    command: # web.enalbe-lifecycle은 api 재시작없이 설정파일들을 reload 할 수 있게 해줌
      - '--config.file=/etc/prometheus/prometheus.yml'
      - '--storage.tsdb.path=/prometheus'
      - '--web.console.libraries=/usr/share/prometheus/console_libraries'
      - '--web.console.templates=/usr/share/prometheus/consoles'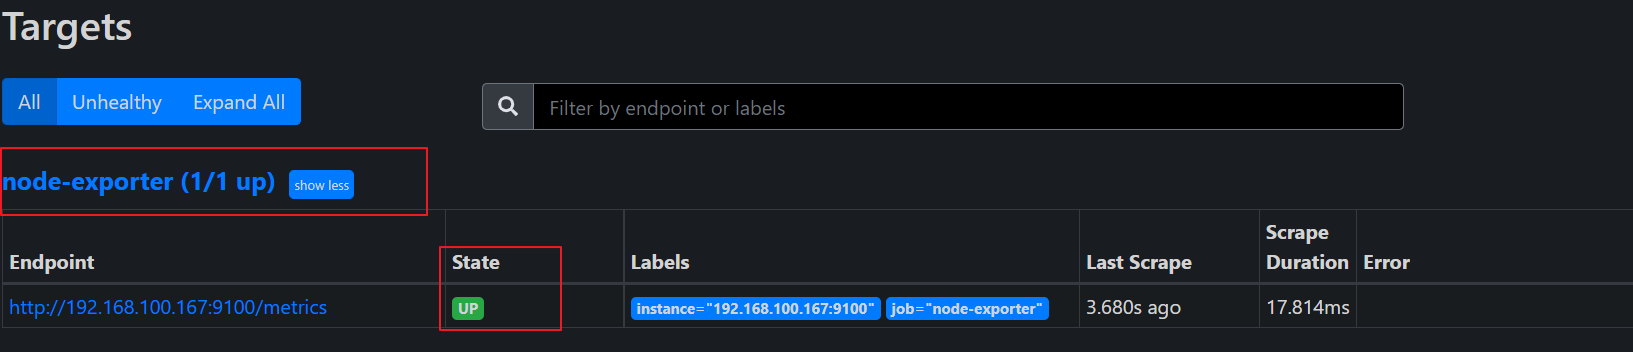
restart: always- 위처럼 docker-compose 를 작성하여 prometheus 컨테이너를 정상 실행 하였다면, localhost:9090/targets 으로 접속합니다.
- 다음과 같이 node-exporter 가 정상적으로 수행되고 있는 것을 확인할 수 있습니다.
Grafana 대시보드 구축
- Grafana 역시 docker-compose.yml 을 통해 컨테이너를 실행합니다.
  grafana:
    container_name: grafana
    image: grafana/grafana
    restart: always
    ports:
- 3000:3000- 위 처럼 docker-compose.yml 에 Grafana 이미지를 추가했다면, 컨테이너를 실행합니다.
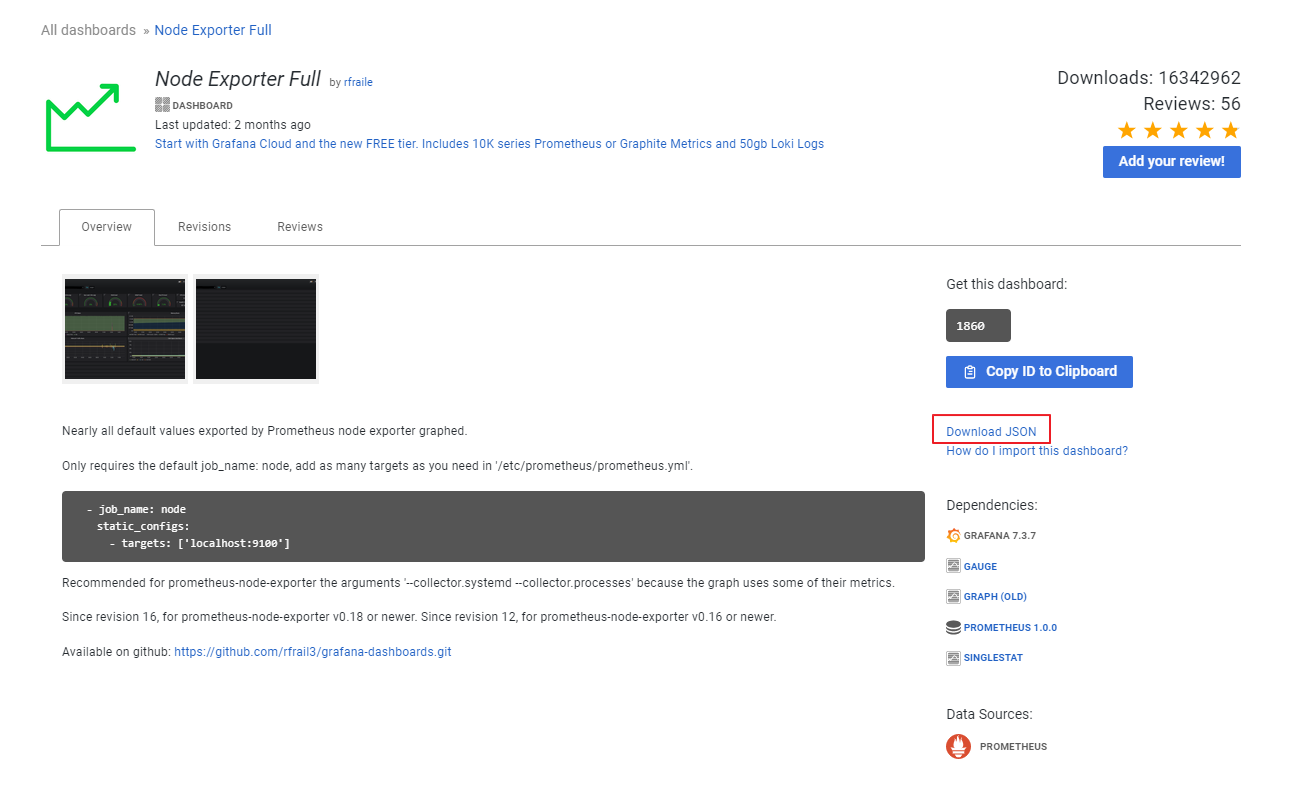
node-exporter Grafana DsahBoard 다운로드
- 이미 node-exporter 관련해서 무료로 공개된 DashBoard 들이 있습니다.
- 이 중에서 node-exporter 대시보드 해당 URL 에 있는 대시보드를 다운로드 하여 적용 시켜 봅니다.
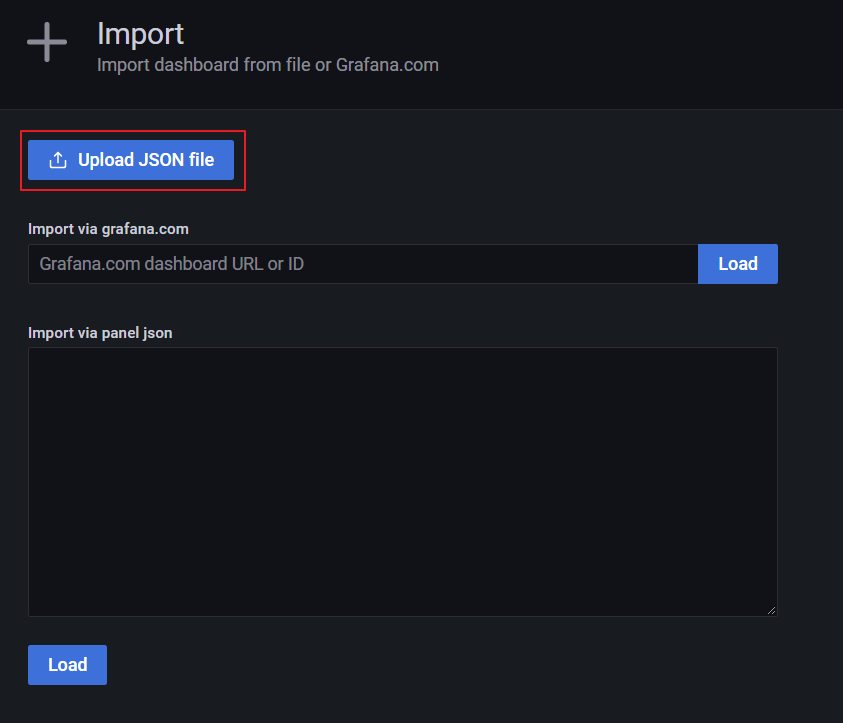
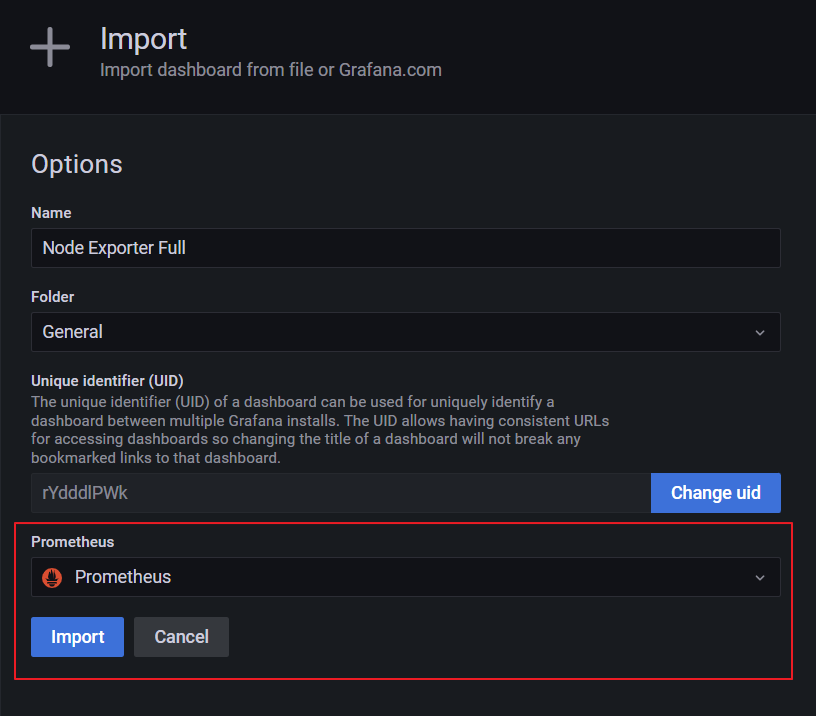
node-exporter 대시보드 적용하기
localhost:3000접속 후, 다음 방법을 통해, 앞서 다운로드 받은 node-exporter 대시보드를 적용합니다.

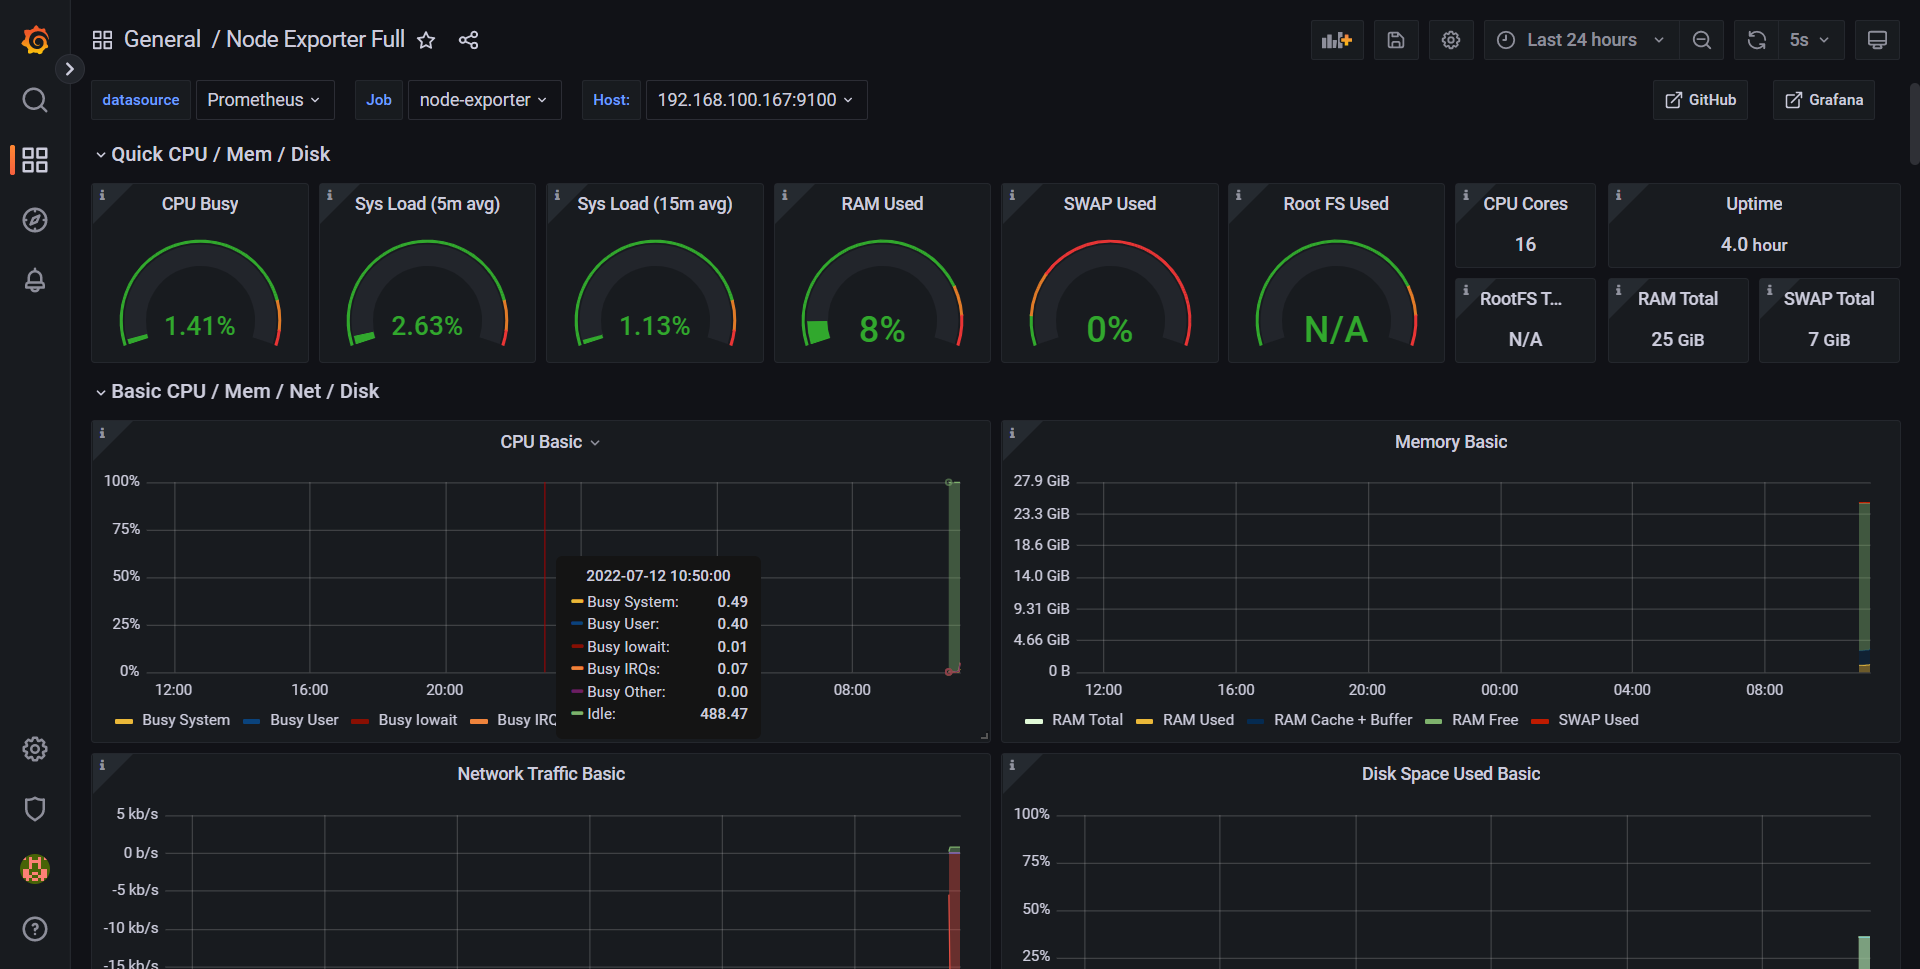
실행 결과
- 실행 결과, 정상적으로 대시보드에서 정보들이 표시되는 것을 확인할 수 있습니다.
728x90
'인프라 > 그라파나 & 프로메테우스' 카테고리의 다른 글
| [인프라] 프로메테우스 메트릭 종류 (0) | 2022.07.22 |
|---|---|
| [인프라] PostgreSQL, Grafana 연동하여 Tuple 통계 DashBoard 만들기 (0) | 2022.07.17 |
| [인프라] 프로메테우스란? (0) | 2022.07.16 |
| [인프라] PostgreSQL, Grafana, Prometheus 연동하기 (0) | 2022.07.15 |
| [인프라] PostgreSQL, Grafana 연동 (0) | 2022.07.15 |


