
[인프라] prometheus-net ASP.NET Core 사용
- 인프라/그라파나 & 프로메테우스
- 2022. 7. 24. 00:58

개요
- prometheus-net 에서 제공하는 ASP.NET Core 라이브러리를 이용하여 실제 .NET 6 버전의 ASP.NET Core 프로젝트 하나 생성 후, 프로메테우스에서 메트릭 수집이 이루어 지는지 PoC 진행 합니다.
ASP.NET Core Web API 프로젝트 생성
- Visual Studio 에서 기본 ASP.NET Core Web API 프로젝트 하나를 생성합니다.
- Version : .NET 6
prometheus-net NuGet Package 추가
- 프로젝트 생성이 완료 되었으면, prometheus-net NuGet Package 를 추가합니다.

ASP.NET Core 다른 PC에서도 접근 가능하도록 코드 추가
- Prometheus 서버는 Docker Container 로 실행 하고, 외부에서 현재 테스트 진행하는 ASP.NET Core 웹 응용 프로그램이 접근하게 됩니다.
- 하지만, 이때 외부에서는 접근할 수 없는 문제가 발생합니다.
- 때문에, 외부에서도 접근할 수 있게 하려면 ListenAnyIP 메서드를 호출해주면 됩니다.
- 코드는 Program.cs 에 다음과 같이 추가해 주면 됩니다.
- 저는 테스트로 5001 포트를 지정하여, 외부에서 ASP.NET Core 웹 응용프로그램에 접근할때에는
localhost:5001로 접근할 수 있도록 지정해 주었습니다.
using Prometheus;

var builder = WebApplication.CreateBuilder(args);

builder.WebHost.ConfigureKestrel(options =>
{
    options.ListenAnyIP(5001); // to listen for incoming http connection on port 5001
});


...생략...
위처럼 port 를 지정해 주지 않으면, Prometheus 서버가 ASP.NET Core 웹 응용프로그램에 접근하지 못하기 때문에, Prometheus 에서 Metric 을 수집하지 못하는 문제가 발생합니다.
메트릭 수집 코드 작성
- 이제 prometheus-net 에서 제공해주는 counter 를 사용하여 Metric 에서 표현하는 코드를 추가합니다.
- program.cs 에 다음과 같은 코드를 추가하였습니다.
...생략

var counter = Metrics.CreateCounter("beomtest_path_counter", "Counts requests to the People API endpoints", new CounterConfiguration
{
    LabelNames = new[] { "method", "endpoint" }
});
app.Use((context, next) =>
{
    counter.WithLabels(context.Request.Method, context.Request.Path).Inc();
    return next();
});
// Use the Prometheus middleware
app.UseMetricServer();
app.UseHttpMetrics();

...생략
프로그램 실행 후, Metric 확인
- 이제 테스트 진행항 코드를 작성 하였으니, 프로그램 실행 후 실제 메트릭 정보가 수직 되는지 확인 진행합니다.
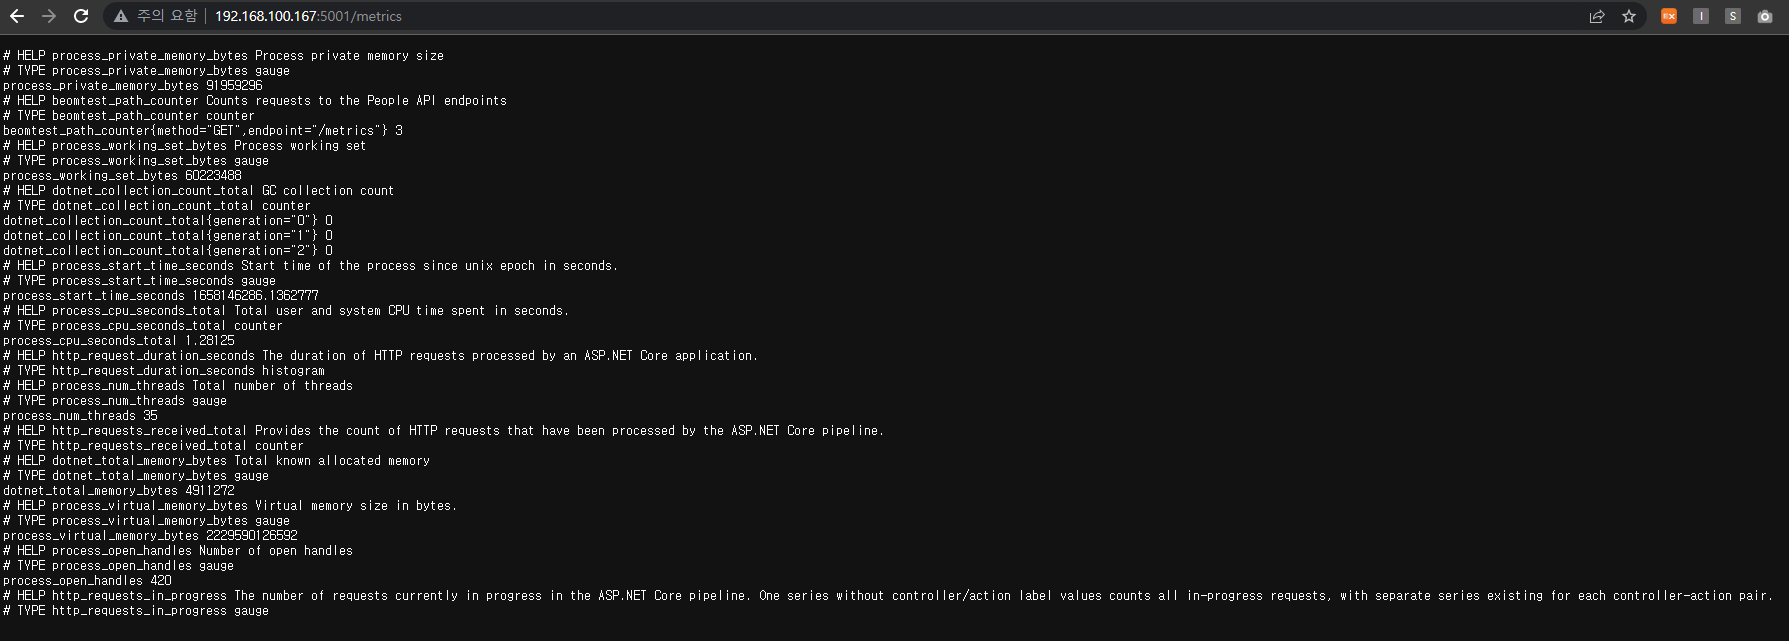
- 메트릭 정보 수집을 확인하기 위해서는
http://localhost:5001/metricsURL 로 접속하여 확인할 수 있습니다. - 확인 결과, 메트릭 정보가 정상적으로 수집 되는 것을 확인할 수 있습니다.
프로메테우스 Docker 실행
- 앞서, ASP.NET Core 응용 프로그램에서 메트릭 수집을 할 수 있도록 하였습니다.
- 이제 프로메테우스 컨테이너를 실행하여 앞서 생성한 메트릭 정보를 프로메테우스 서버에서 수집할 수 있도록 진행 합니다.
- 프로메테우스는 Docker-Compose 로 작성하여 컨테이너 실행하도록 하였습니다.
version: '3.4'

services:
  prometheus:
    image: prom/prometheus
    container_name: prometheus
    ports:
      -  9090:9090
    volumes:
      - D:/postgresql/prometheus/data/:/prometheus
      - D:/postgresql/prometheus/:/etc/prometheus/
    command: # web.enalbe-lifecycle은 api 재시작없이 설정파일들을 reload 할 수 있게 해줌
      - '--config.file=/etc/prometheus/prometheus.yml'
      - '--storage.tsdb.path=/prometheus'
      - '--web.console.libraries=/usr/share/prometheus/console_libraries'
      - '--web.console.templates=/usr/share/prometheus/consoles'
restart: always- docker-compose 작성을 완료 하였다면, prometheus.yml 파일을 만들어서 앞서 생성했던 ASP.NET Core 웹 응용프로그램의 메트릭 정보를 수집하는 Job 을 하나 등록해 주어야 합니다.
- Job 등록은 prometheus.yml 에서 진행할 수 있고, 다음과 같이 작성을 하면 됩니다.
global:
  scrape_interval:     10s
  evaluation_interval: 10s
  scrape_timeout:       5s

#
# Load rules once and periodically evaluate them according to the global
# 'evaluation_interval'.
#
rule_files:
  # - "first_rules.yml"
  # - "second_rules.yml"

scrape_configs:
  # Scrape Prometheus itself.
  - job_name: 'prometheus'
    # metrics_path defaults to '/metrics'
    # scheme defaults to 'http'.
    static_configs:
    - targets: ['192.168.100.167:9090']

  - job_name: 'dotnet-test-api'
    scrape_interval: 5s
    static_configs:
- targets: ['192.168.100.167:5001']- 위와 같이 dotnet-test-api Job 을 등록한 것을 볼 수 있습니다.
- 이제 prometheus 컨테이너를 실행 하여, 실제로
dotnet-test-apiJob 메트릭 정보를 프로메테우스 서버가 정상적으로 수집 하는지 확인합니다.
prometheus 컨테이너 실행
- prometheus 컨테이너 실행은 다음 명령어를 통해 실행할 수 있습니다.
> docker-compose up prometheusMetric 수집 확인
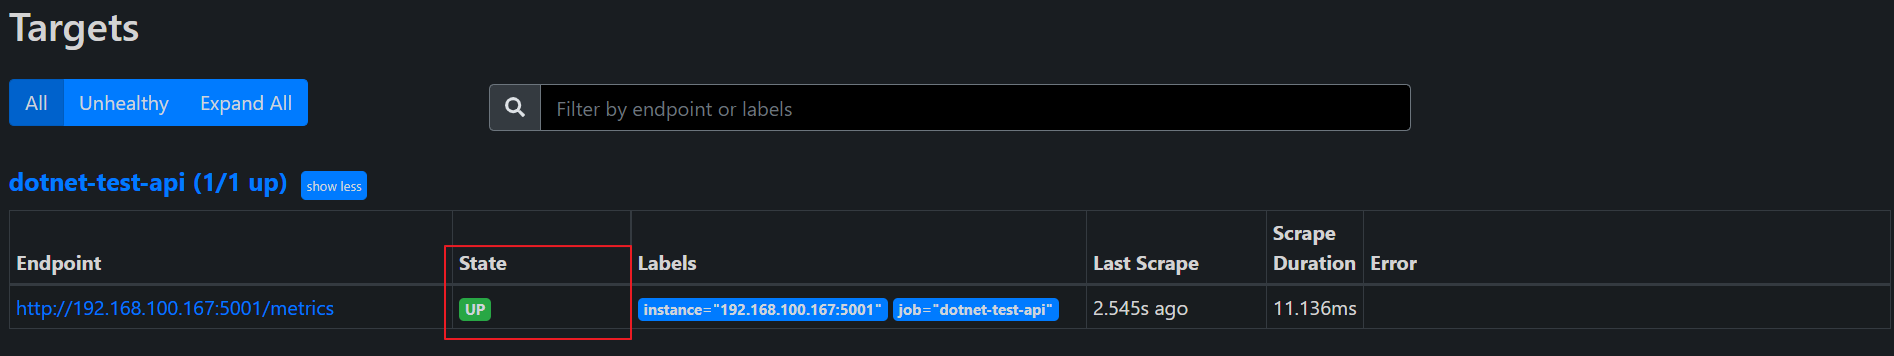
- 프로메테우스 컨테이너가 정상적으로 실행 되었다면,
localhost:9090/targets에 접속하여 dotnet-test-api 메트릭을 수집하는지 상태 확인합니다. - 확인 결과, 정상적으로 dotnet-test-api 메트릭을 수집하고 있는 것을 확인할 수 있습니다.
728x90
'인프라 > 그라파나 & 프로메테우스' 카테고리의 다른 글
| [인프라] 프로메테우스 데이터 구조 (0) | 2022.07.24 |
|---|---|
| [인프라] prometheus-net 메트릭 통계 (0) | 2022.07.24 |
| [인프라] prometheus-net C# 콘솔 (0) | 2022.07.23 |
| [인프라] 프로메테우스 메트릭 종류 (0) | 2022.07.22 |
| [인프라] PostgreSQL, Grafana 연동하여 Tuple 통계 DashBoard 만들기 (0) | 2022.07.17 |


